
Features overview
-
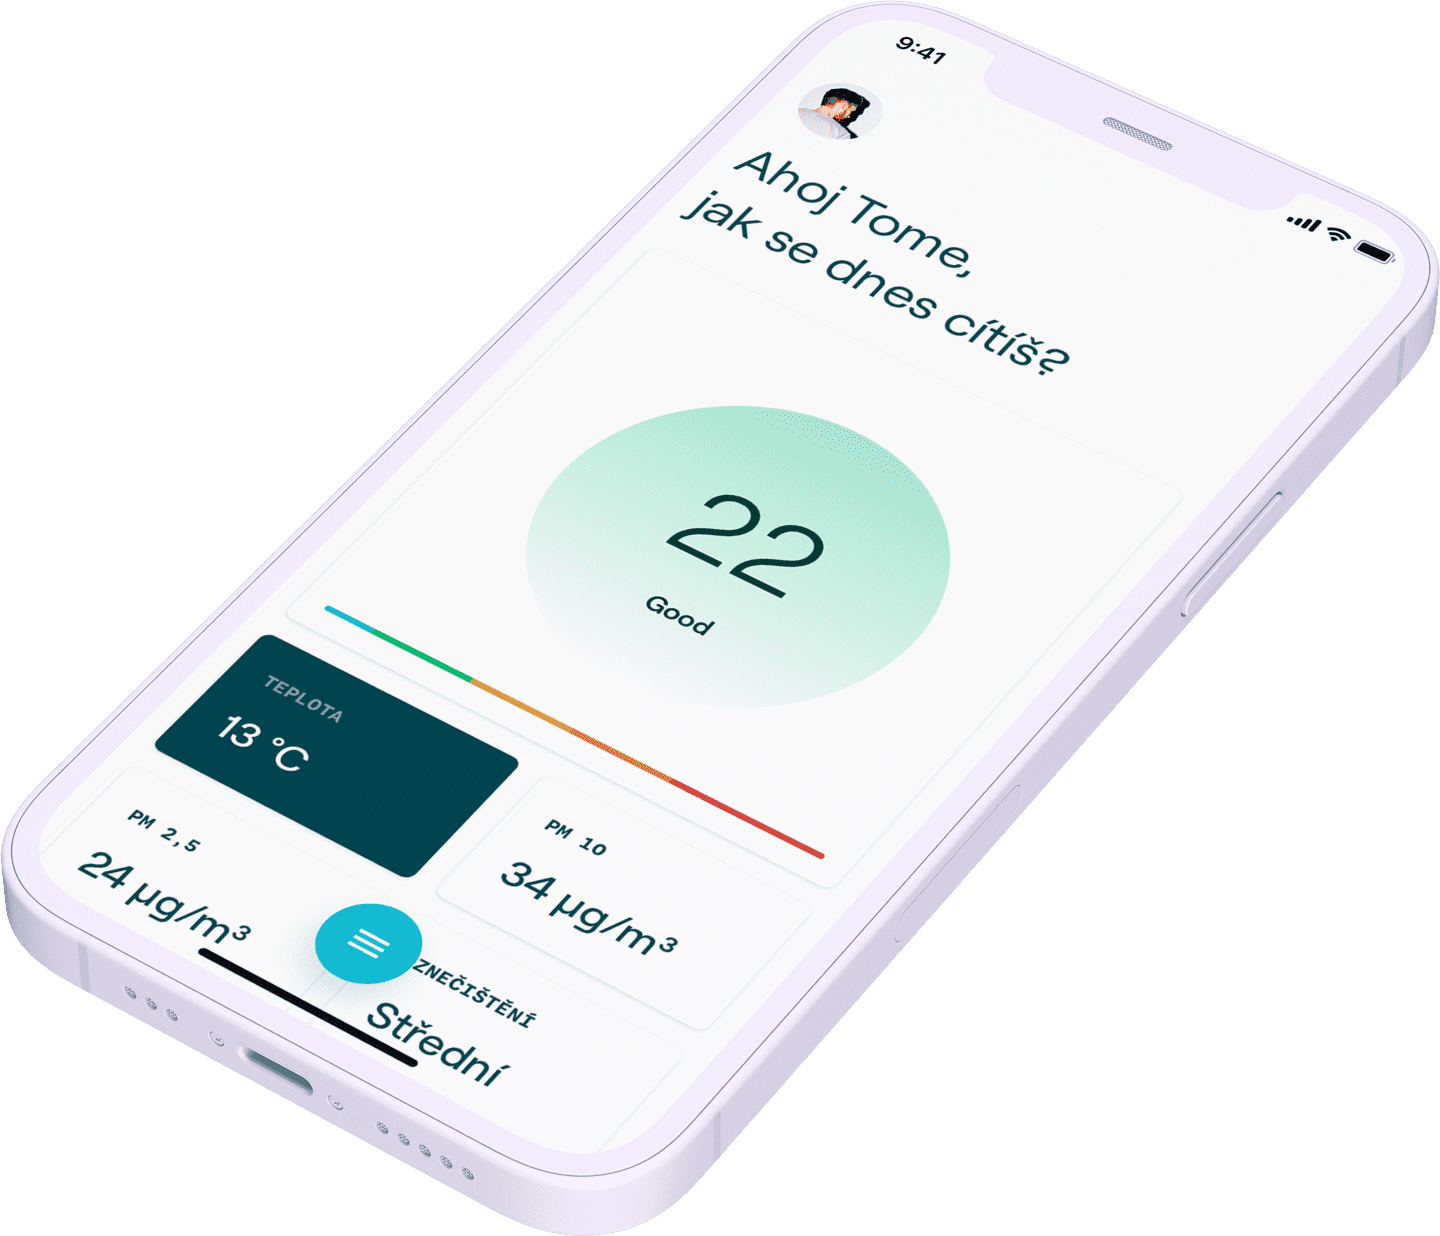
Air quality
Degree of particulate matter pollution PM10 and PM2,5 and less.
-
Air properties
Particulate matter, pollen, ozone, temperature, atmospheric pressure, carbon dioxide.
-
Recommendation
Recommendation and hints on behavior and what to avoid with regards to the current air quality.
-
Notifications
Application immediately notifies you of lower air quality.
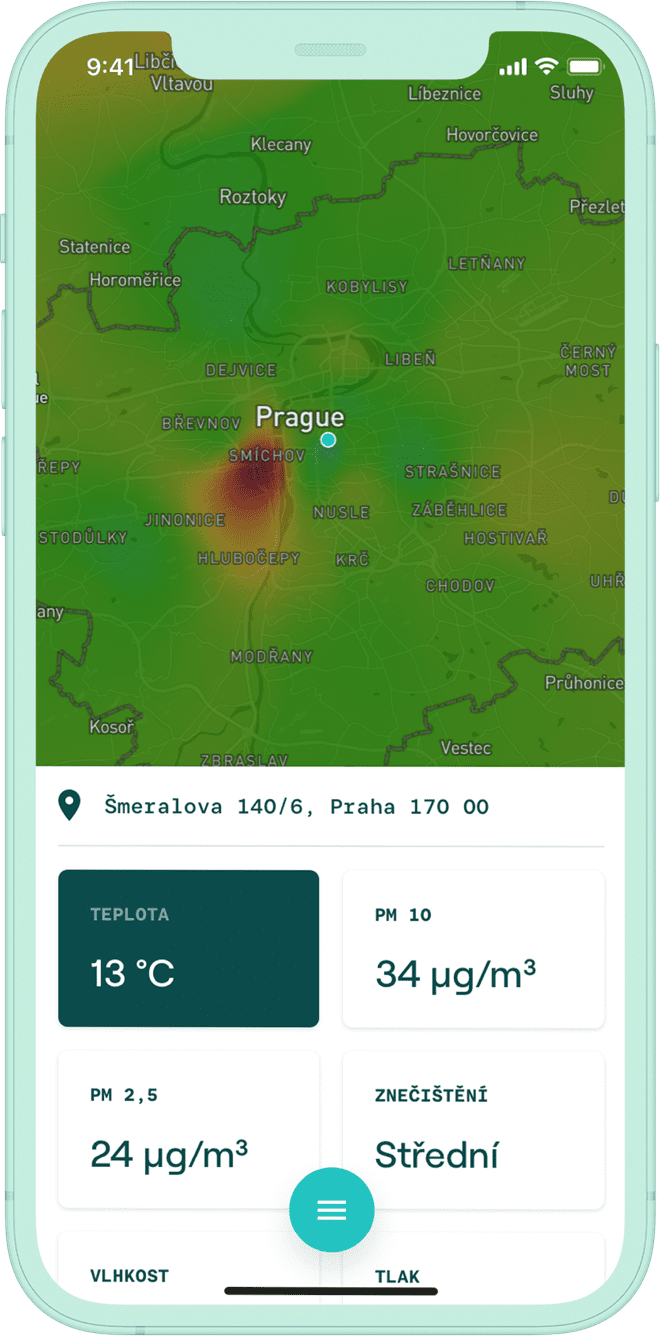
You will have up-to-date overview of the air quality in your city. Our map displays air quality index in the real time including particulate matter concentration PM2,5, PM10, NO2 and O3.
From the pollution index you simply find out the degree of air pollution in location of your interest.
Look for any city in the world
and take a look at its air quality.
Every 3 minutes the application updates measured data and sends you notifications of changes in air quality at your location. You can then react in time and adequately.
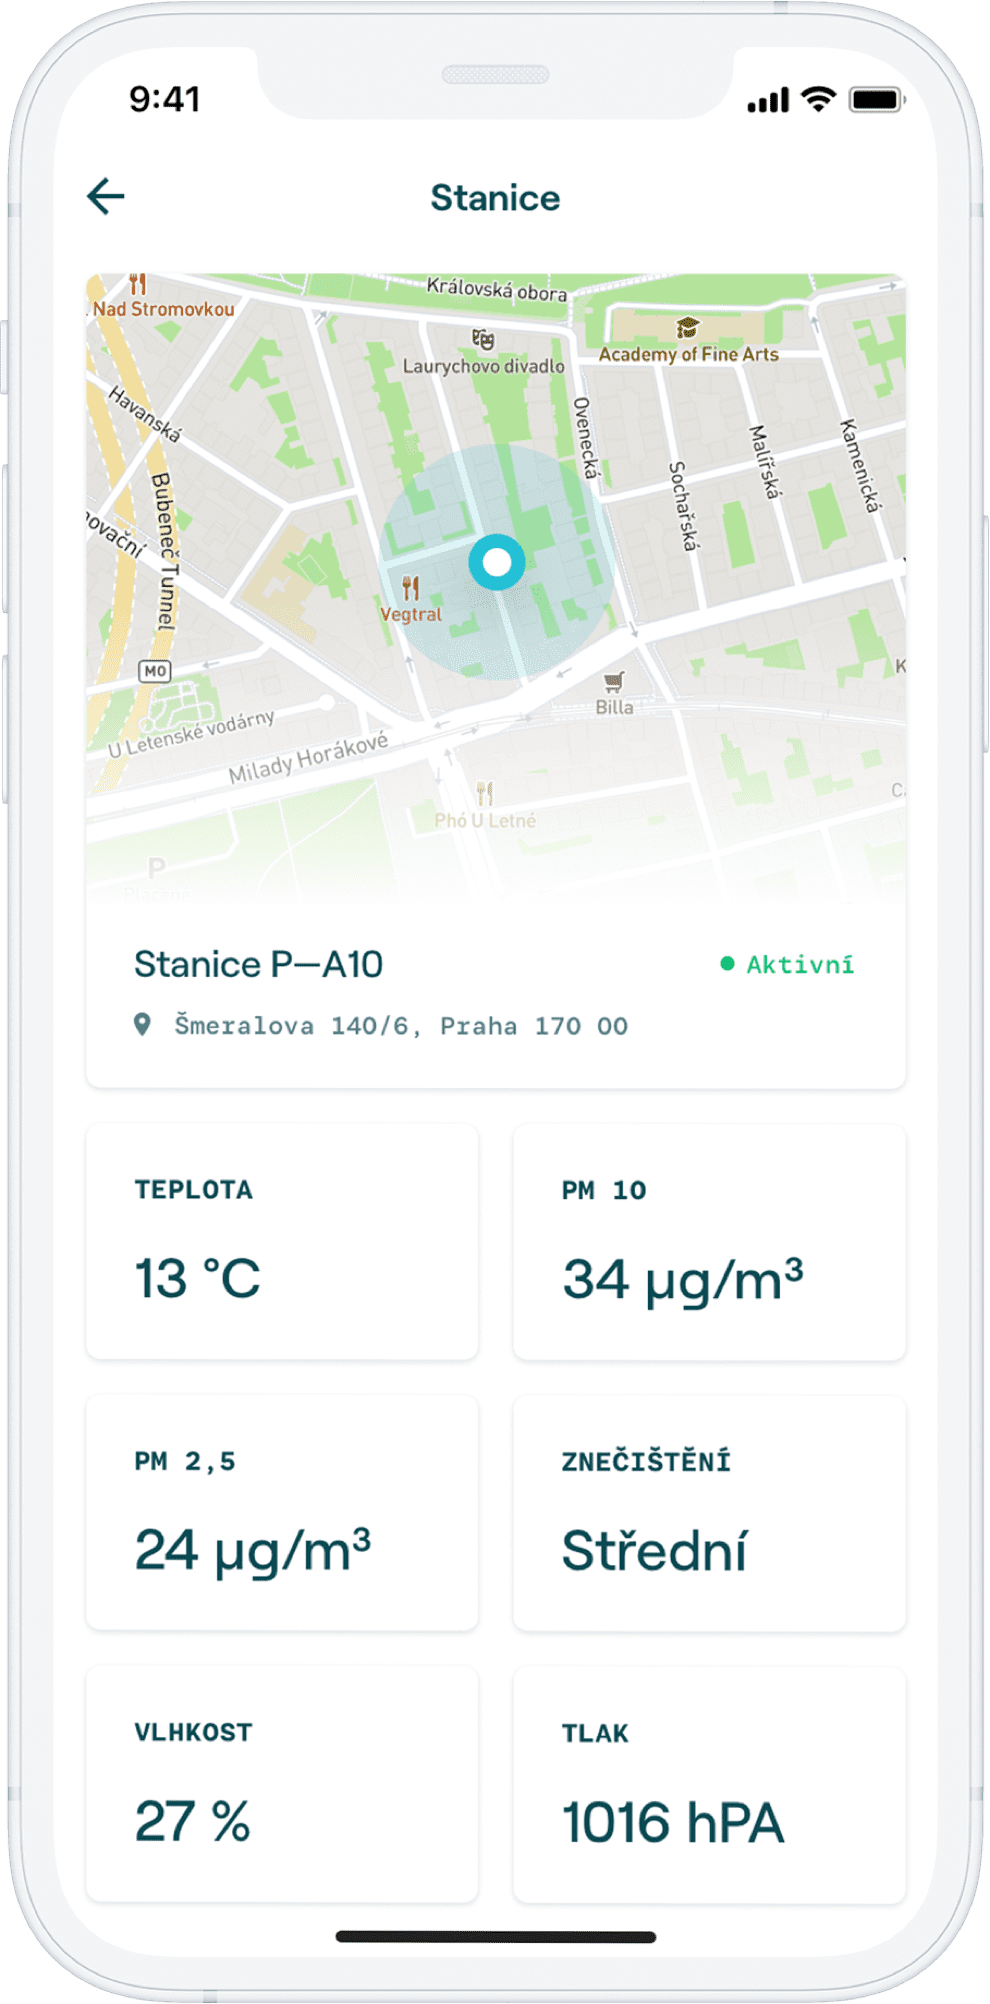
Our application cooperates with
P-A 10 station which sends new data every 3 minutes.
Our API enables smart devices (IoT) to use data on air quality.
Based on air pollution at the installation site a smart device can.
Ask us about the option of registering API key and start using our data in your products. It will give you a competitive advantage.
Features overview
-
Extended data sources
Environmental scientists always had to rely on open dara from public monitoring stations. Our data science team works with many more resources.
-
Forecast modeling
As with the weather, reliable forecast of pollen concentration development in the air over the next few days and its impact on our health is a mathematically challenging matter.
-
Interpret data your way
There is no uniform way of interpreting numbers. Sometimes is required concentration of particles per cubic meter of air.
